Analyze sales activity to decide what to prioritize
Consolidate sales data around agreed KPIs and views. Track changes, analyze opportunities and drill into details to prepare sales decisions.
Product interface
The main screen your team works in every day.
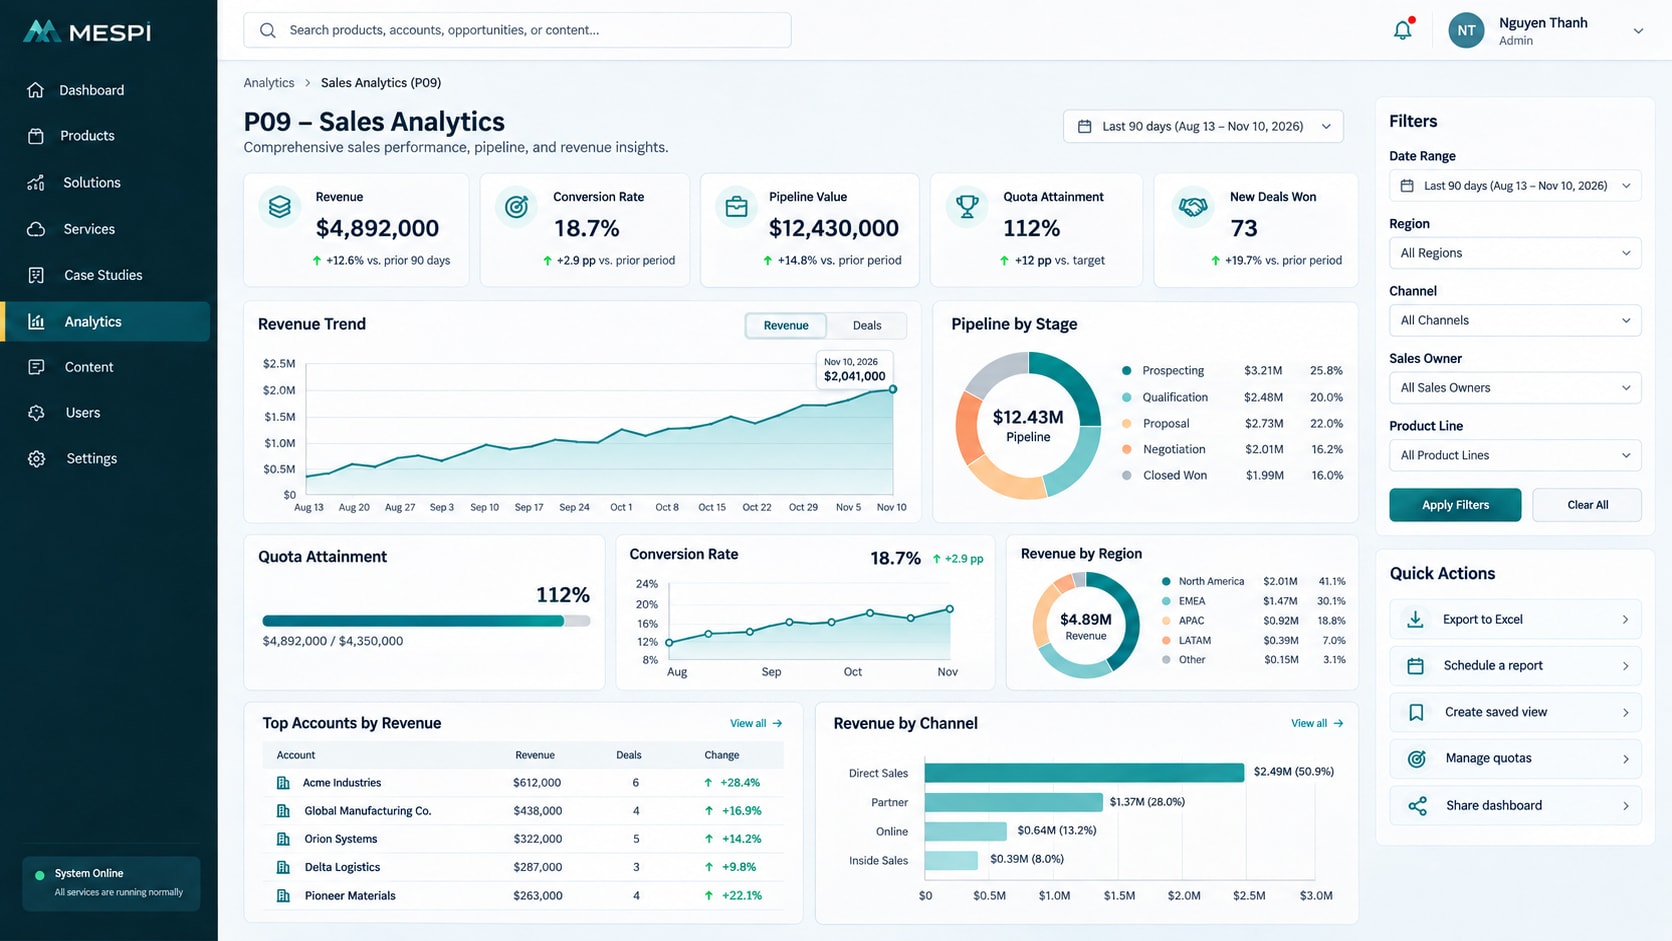
Who it helps and how
Review lists built from real data.
KPIs by department and alerts on thresholds.
Every KPI has a definition, source and refresh time.
How it works
- Choose the data scope
- Review KPIs
- Analyze segments or opportunities
- Record next steps or turn them into tasks
Feature groups
- Sales data connections
- KPIs and filters
- Pipeline and results analysis
- Review lists and reports
Data and integration
Connects CRM, ERP, spreadsheets and business databases. KPI definitions are agreed before reports are built.
Source records stay in your CRM.
Deployment and use
We start with the product, clarify configuration and the data or systems to connect, then set up users, training and support as agreed.
Standard SaaS or private deployment
Frequently asked questions
How often are reports updated?
Update frequency depends on data sources and operational needs.
Can we drill down from summary KPIs?
KPI design and permissions define which details each user can see.
Do we need to replace our current systems?
The scope focuses on connected data; changes to source systems are assessed separately.